
- By Admin
- 08/19/2026 12:10:53
 ALL
ALL
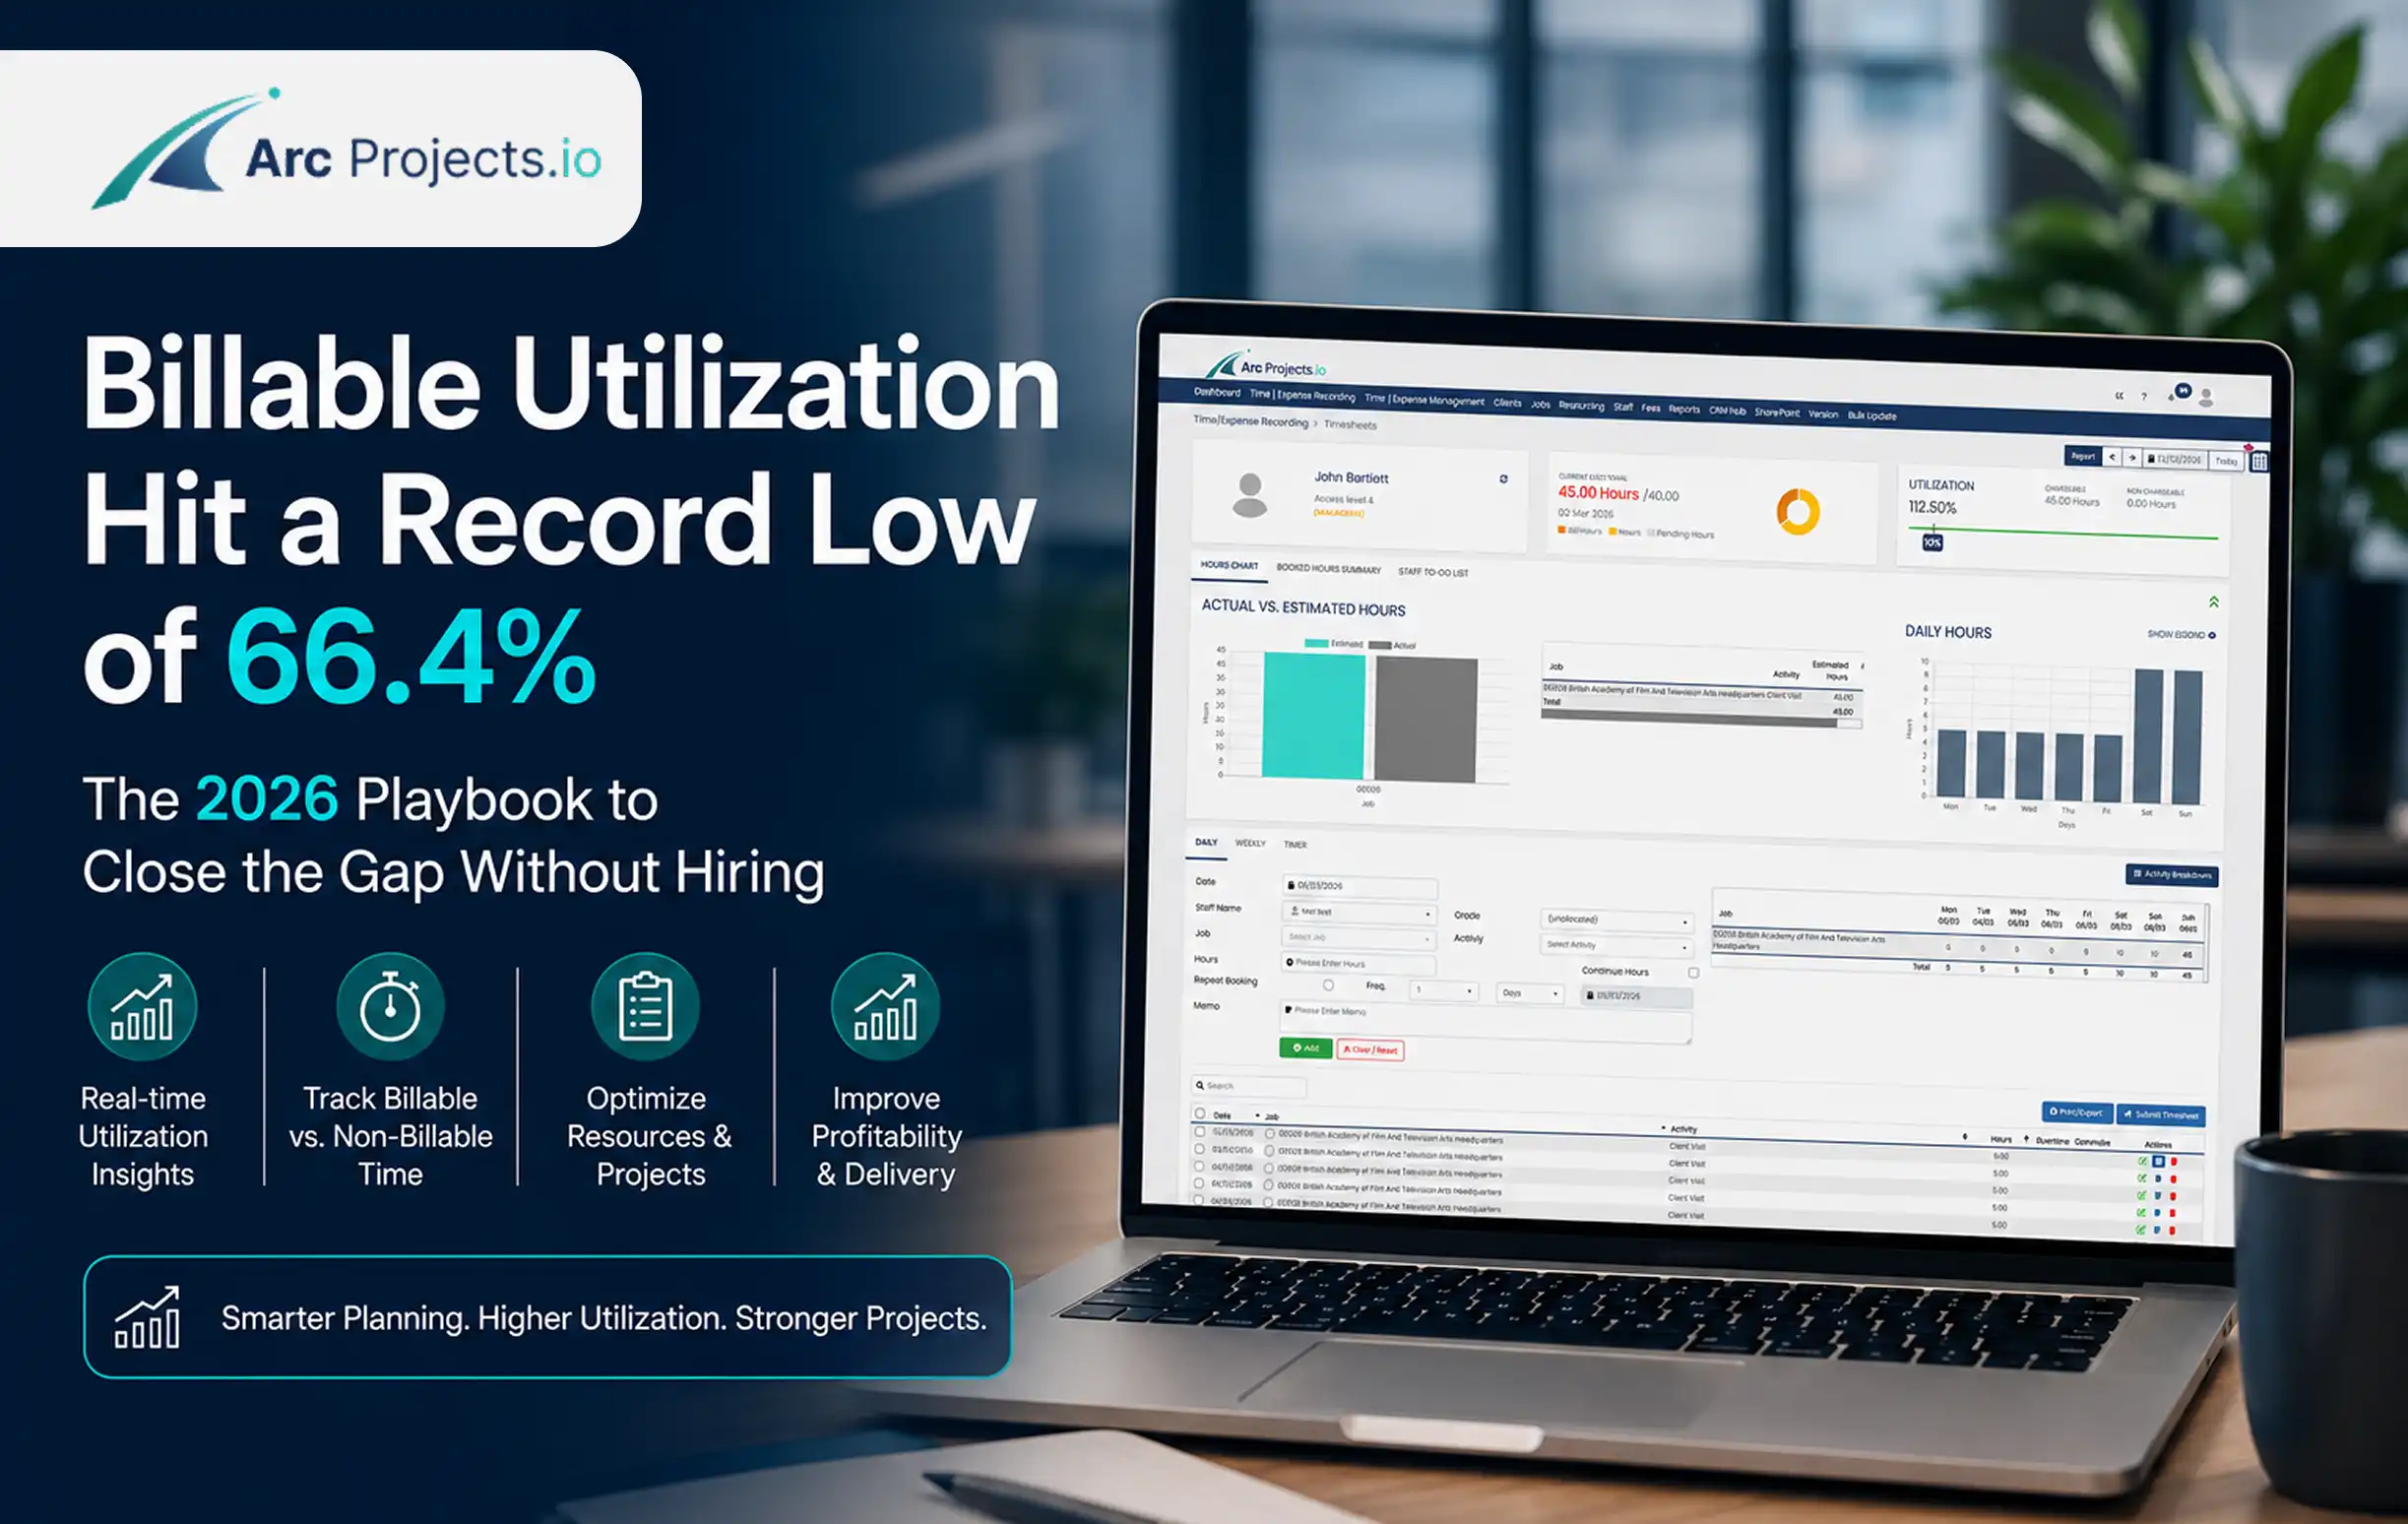
Billable Utilization Hits a Record Low: 66.4%
American consultancies are not short of work. They are short of billable delivery. The 2026 SPI/Deltek Professional Services Maturity Benchmark put the average billable utilization rate at 66.4% — the lowest reading in the survey's 19-year history — while pipeline coverage sat at 175% of quarterly bookings. That combination is unusual, and it is expensive.
If your firm bills for time and expertise, utilization is the hinge on which everything else turns. Every point of billable utilization you lose is revenue you already paid salary for. At a fully loaded cost of $140,000 per consultant, the gap between 66.4% and the 75% optimal threshold is roughly $12,000 of unrecovered capacity per person, per year. Across a 60-person delivery team, that is more than $700,000 sitting inside your existing payroll.
This article breaks down what the 2026 benchmark actually says, why the decline is happening in US firms specifically, and how operations leaders are recovering the lost points through measurement and scheduling discipline rather than headcount.
Key takeaways
- US billable utilization fell to 66.4% in 2025, the weakest result in 19 years of SPI benchmarking, against a 75% optimal threshold.
- EBITDA across the benchmarked firms stalled at 9.9%, so the utilization loss is landing directly on profit rather than being absorbed by rate increases.
- Pipeline coverage of 175% of quarterly bookings confirms the constraint is conversion and delivery capacity, not demand.
- Most firms cannot see utilization until month-end close, by which point the lost hours are unrecoverable.
- Recovering 8 to 9 points of utilization is a scheduling, timesheet-hygiene and visibility problem before it is a hiring problem.
Why this matters right now in the United States
The US professional services market has spent two years absorbing contradictory pressures. Buyers slowed decision cycles while continuing to build pipeline, so proposals stacked up without converting. Firms that had over-hired through 2022 and 2023 held on to bench capacity in anticipation of a rebound that arrived later and smaller than forecast. Meanwhile, AI-assisted delivery compressed the hours required on exactly the routine engagements that used to keep junior consultants fully loaded.
The result is structural rather than cyclical. A US firm today typically carries more people than its converted backlog justifies, and the internal work absorbing those people — enablement, tooling, internal AI pilots, proposal support — is real work that produces no invoice. That is precisely how a firm arrives at 175% pipeline coverage and 66.4% utilization at the same time.
There is also a measurement problem hiding underneath the number. The SPI benchmark defines utilization consistently across 500-plus firms, but individual firms rarely do. Some count against a 2,080-hour year, some against 1,880 after PTO and holidays, some exclude partner time entirely. If your reported utilization is calculated on a denominator that quietly excludes the least productive hours, your real number is lower than the one on your dashboard — and your comparison to the benchmark is flattering you.
What it means for COOs and delivery leaders at US consultancies
For a COO or resourcing leader at a 25 to 500-consultant firm, the 2026 benchmark should change three operating decisions.
First, it moves utilization from a reporting metric to a forward-looking one. Historical utilization tells you what you already lost. Forward utilization — committed hours against available capacity for the next six to twelve weeks — tells you where the bench is forming while you can still sell into it or redeploy against it.
Second, it makes non-billable time a category that has to be budgeted, not just tolerated. Firms recovering utilization are not eliminating internal work; they are giving it a code, a budget and an owner, so that a consultant spending 30% of their quarter on an internal AI initiative is a deliberate investment decision rather than an accidental margin leak.
Third, it reframes the hiring conversation. With EBITDA at 9.9%, most US firms cannot fund speculative hiring. The practical question is no longer "how many people do we need?" but "which skills are we short of in weeks eight through sixteen, and can we cover that with redeployment, cross-training or a subcontractor before we add permanent cost?"
Three practical implications for your delivery model
Weekly, not monthly, visibility
A month-end utilization report is an autopsy. Firms closing the gap review utilization and forward capacity weekly, so an emerging bench is spotted with six weeks of runway rather than six days.
Timesheet completeness is the input
Utilization is only as accurate as time capture. Missing or retrospectively guessed hours understate billable work and overstate the bench, and they cannot be reconstructed at invoicing time.
Pipeline must feed the resource plan
With coverage at 175%, the difference between a full team and an idle one is whether probable opportunities are weighted into the forward schedule before they close, not after.
Spreadsheets, point tools, or a connected platform
| Capability | Spreadsheets | Point tools | Arcprojects.io |
|---|---|---|---|
| Utilization visibility | Monthly, manually rebuilt | Real time, but only for tracked time | Real time across time, cost and capacity in one view |
| Forward capacity forecast | Static, stale within days | Usually absent or add-on | Built in, leave-aware and pipeline-linked |
| Billable vs non-billable split | Depends on manual coding | Supported | Enforced at entry, reported by client, project and role |
| Link to invoicing | Re-keyed by hand | Separate billing tool required | Approved time flows straight into the invoice |
| Margin and profitability view | Quarterly at best | Not included | Per project and per client, updated continuously |
| Audit trail | Fragile, version-dependent | Partial | Full approval history retained |
| Total cost of ownership | Hidden in admin hours | Multiplied across three or four subscriptions | One platform, one subscription |
How Arcprojects.io helps you close the utilization gap
Arcprojects.io brings resource planning and utilization, timesheets and time tracking, dashboards and profitability tracking into a single platform, which is what makes the 8 to 9 points between the SPI average and the 75% target actually recoverable. The recovery depends on three things happening in the same system: capacity is planned forward, time is captured completely, and the resulting utilization is visible to the people who can act on it.
- Build a real forward capacity baselineModel each consultant's available hours net of PTO, holidays and committed internal work, then load confirmed and weighted-probable engagements against it. The capacity heatmap shows over-allocation and emerging bench six to twelve weeks out, while there is still time to sell, redeploy or cross-train.
- Make time capture complete and low-frictionEnforce weekly timesheet submission with automated reminders and approval workflows, and let consultants log hours from mobile between client sites. Complete time data is the difference between a utilization number you can act on and one you have to caveat.
- Put utilization in front of the decision makers weeklyUtilization dashboards by individual, team, practice and client, alongside realization rate and per-project margin, turn a lagging month-end statistic into a weekly operating conversation with a clear owner for every point of gap.
See your utilization gap in your own numbers
Walk through capacity heatmaps, utilization dashboards and profitability tracking with a specialist who works with US professional services firms.
Request a demo"The firms recovering utilization in 2026 are not the ones with the best forecast. They are the ones who see the bench forming six weeks early and still have room to do something about it."
"We were reporting utilization at 71% and celebrating it. Once every hour was actually captured, the real number was 64%. Seeing that weekly instead of monthly is what let us move four people off internal work and onto a delayed client program before the quarter closed."
Practice leader's utilization checklist
- Write down your utilization formula and confirm every practice uses the same denominator.
- Measure timesheet completeness weekly; utilization reporting is unreliable below 95% submission.
- Give every category of non-billable work a code, a budget owner and a quarterly cap.
- Maintain a rolling twelve-week forward capacity view, not just a backward-looking report.
- Weight pipeline opportunities into the resource plan before they close, not after.
- Review realization rate alongside utilization — billing 80% of hours at a 70% realization is not a win.
- Set a utilization target by role, not one firm-wide number; senior sellers should not carry junior targets.
- Agree a redeployment trigger: how many idle days before a consultant is formally reassigned.
- Reconcile utilization against invoiced revenue monthly to catch time that never reached a bill.
Frequently asked questions
What is a good billable utilization rate for a consulting firm in 2026?
The SPI benchmark treats roughly 75% as the optimal threshold for delivery consultants, against a 2026 average of 66.4%. In practice the target should vary by role: dedicated delivery consultants often sit at 75–80%, senior consultants who also sell closer to 60–70%, and practice leaders lower again. A single firm-wide target usually produces either unrealistic pressure on sellers or slack in delivery. Full methodology is published in the Deltek professional services benchmarks.
How do you calculate billable utilization rate accurately?
Divide billable hours by available hours, and be explicit about the denominator. Available hours should start from contracted annual hours and subtract public holidays, PTO and any structurally committed non-client time. Comparing a firm that uses 2,080 gross hours with one that uses 1,830 net hours produces a difference of more than ten points before any real performance difference is measured. Whichever definition you choose, apply it identically across every practice.
Why is billable utilization falling at professional services firms?
Three forces are compounding in the US market: slower buyer decision cycles leaving pipeline unconverted, headcount held from the 2022–2023 expansion, and AI-assisted delivery reducing the hours required on routine engagements that previously loaded junior staff. The 175% pipeline coverage in the 2026 benchmark confirms the issue is conversion and delivery capacity rather than demand. Underlying data is available in the 2026 SPI/Deltek Professional Services Maturity Benchmark.
Closing the gap without adding cost
A 66.4% utilization rate is not a verdict on your consultants. It is a signal that capacity, demand and time data are being managed in three different places, and that the picture only assembles itself after the month has closed. Firms that recover those points do it by shortening the feedback loop: complete time capture, a forward capacity plan that accounts for leave and pipeline, and a utilization view that reaches delivery leaders while there is still runway to act.
Arcprojects.io was built for exactly that loop. Explore how the resource planning, timesheet, dashboard and profitability modules work together on the features and benefits page, see which firms run on it at who uses Arcprojects, or review pricing. You can also start a 30-day free trial and load a single practice to see your real utilization number before you commit to anything.